Organization and cataloging software

9 replies214 views
joshua deherrera avatar
I like many am getting to point where its getting very hard to keep track of all my data and what the status of every target is.
Is there any software that you can feed in your images and have it build database and keep track of the target address, fov and how many subs of each filter you have etc?
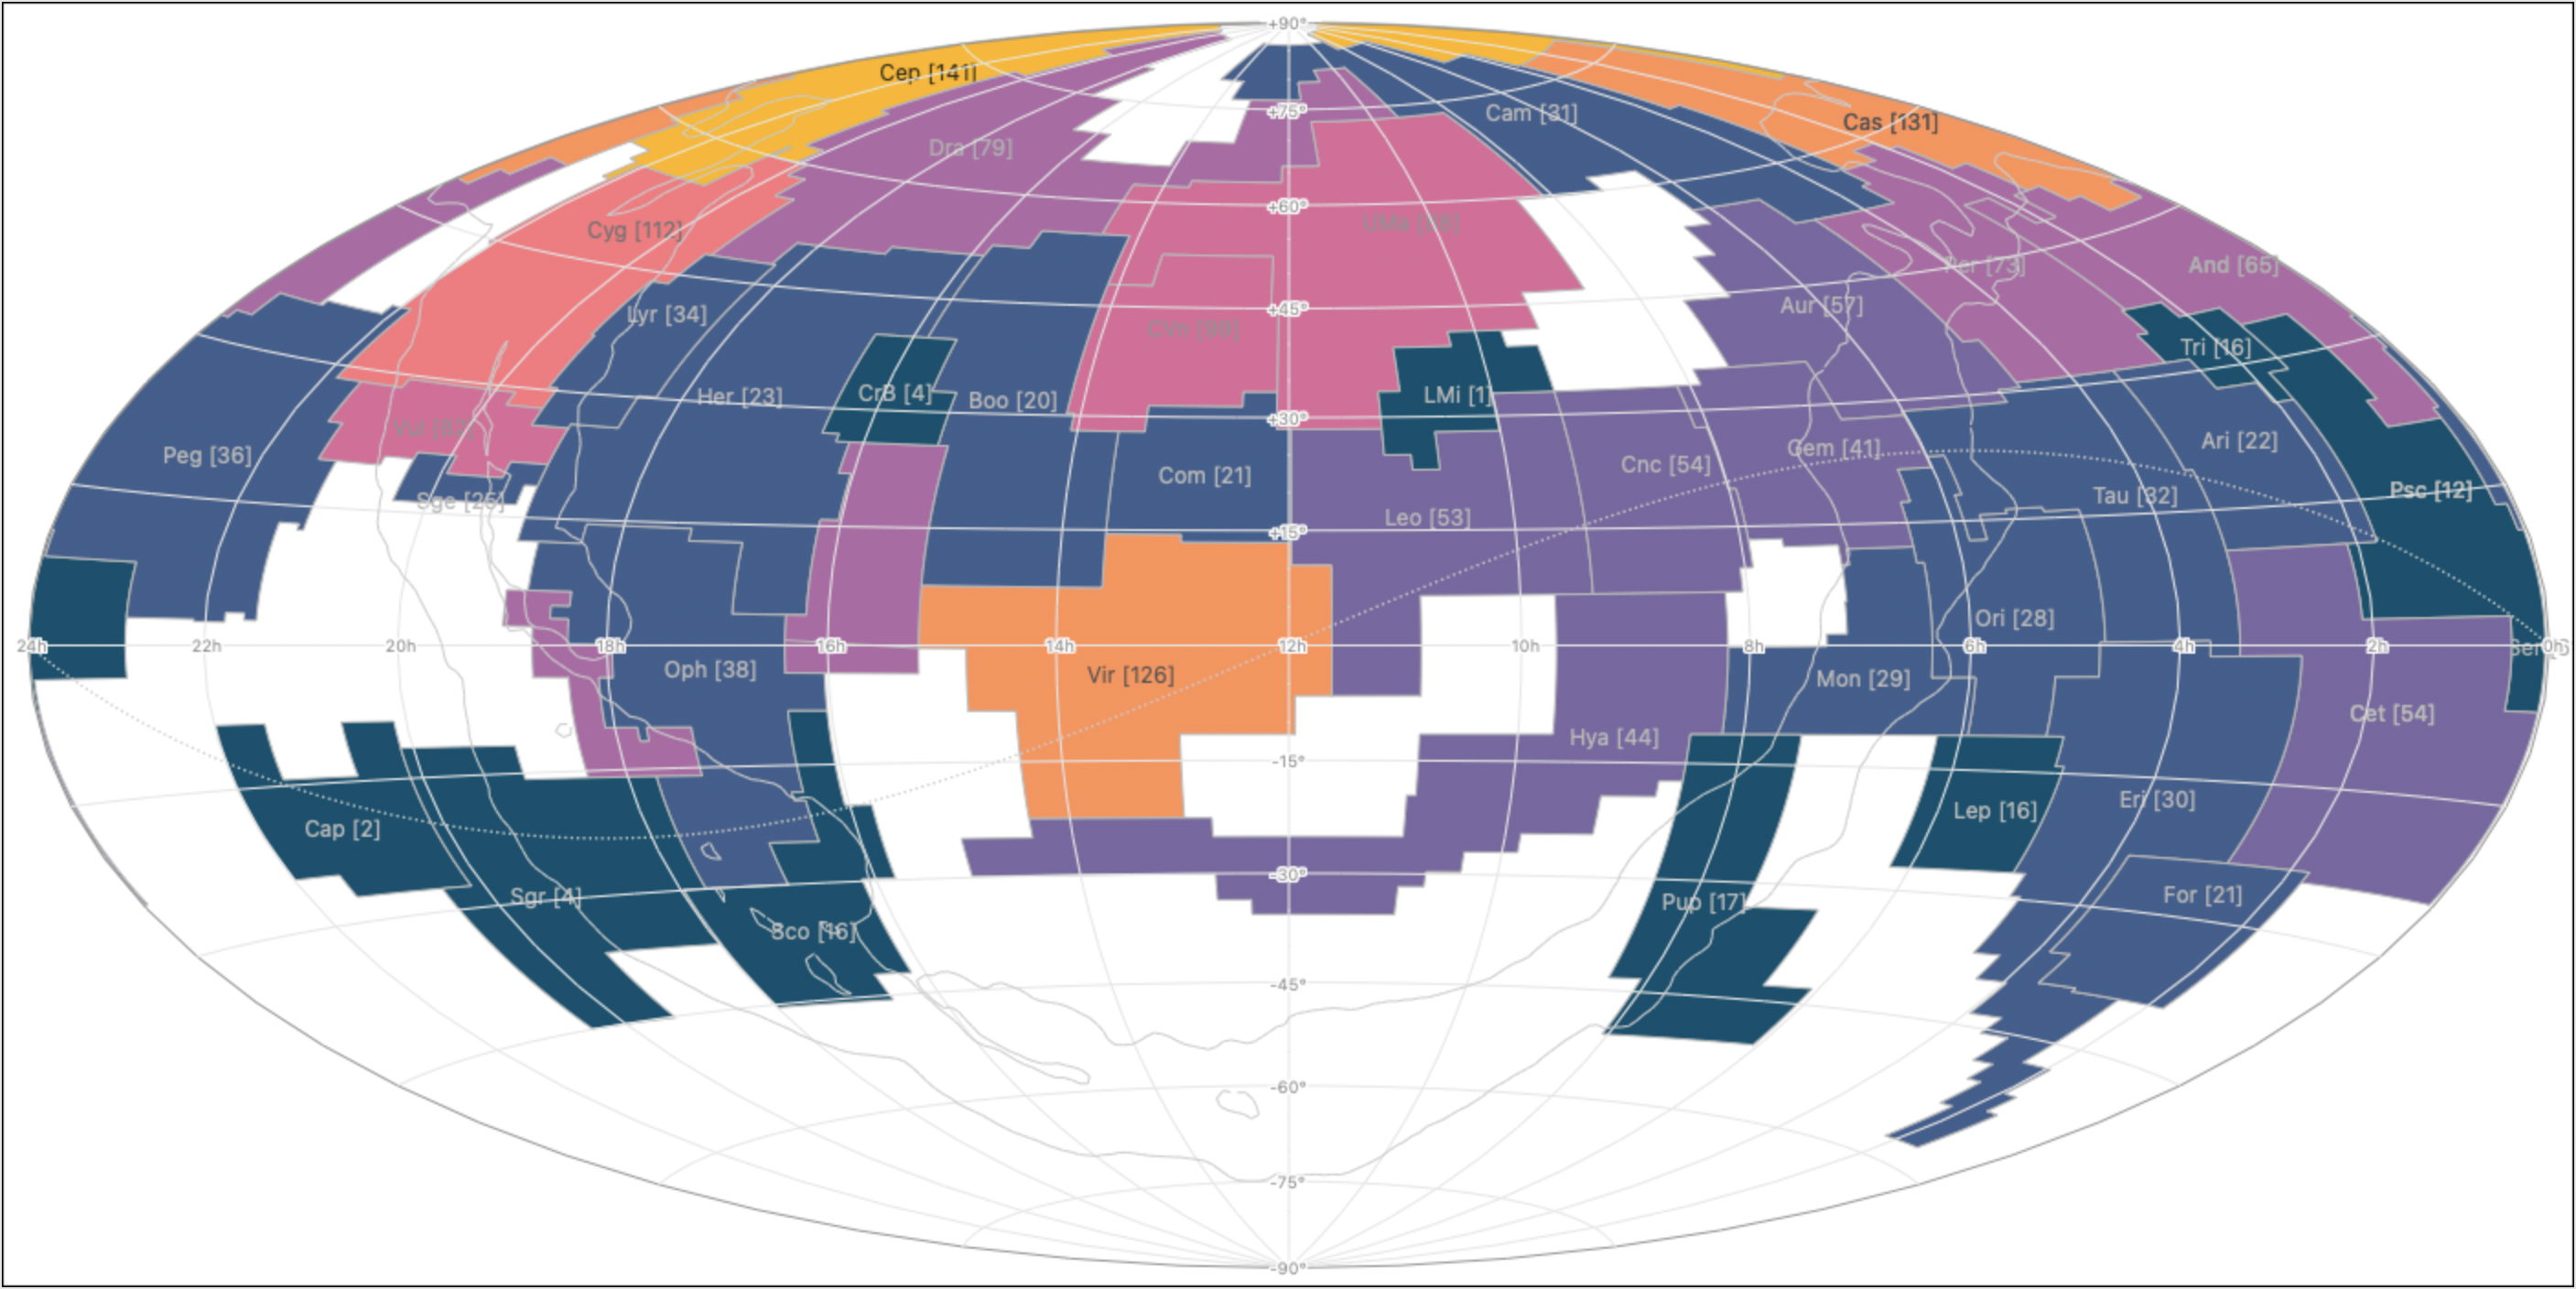
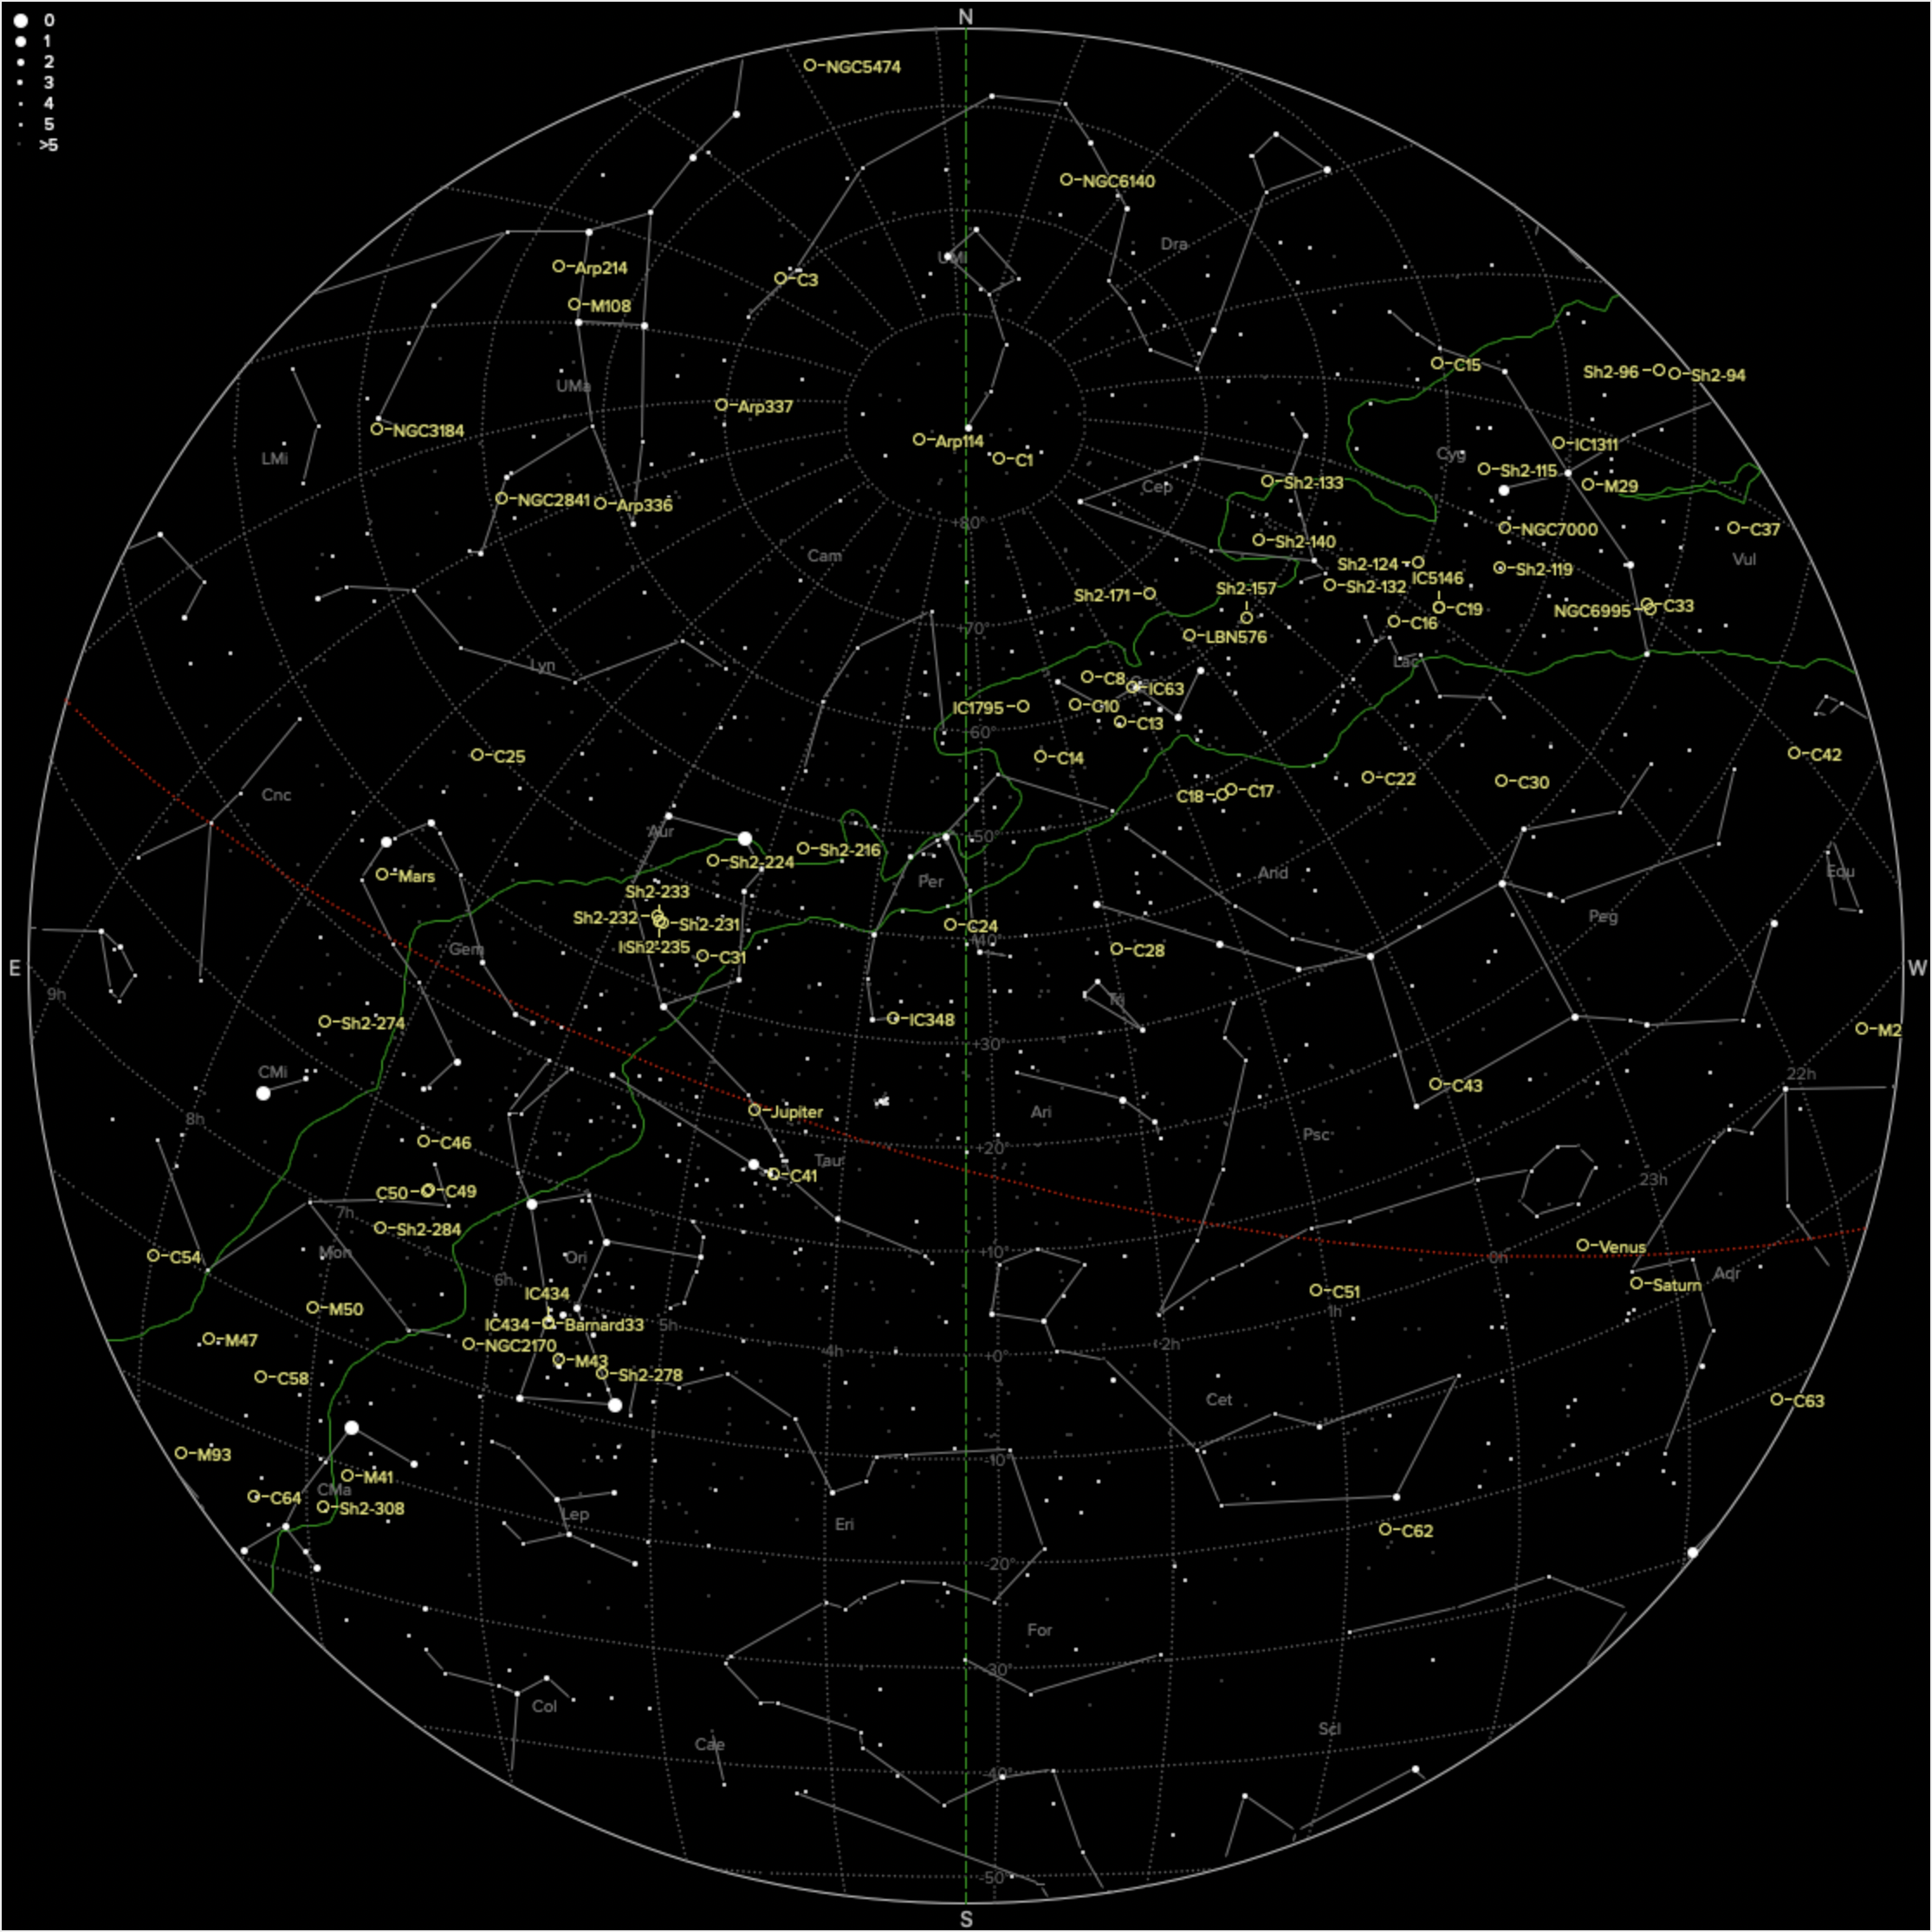
Be even better if it would overlay that onto an interactive all sky globe image for ref.
I envision like how adobe lightroom has the map tab for photo location but with astro coordinates.
Engaging
Noah Tingey avatar
@Alex Helms and @Charles Hagen are working on an astrophotography library/target management software called Lumidex. It does not have all the features you've mentioned in your post, but it's the closest I'm aware of. https://github.com/alexhelms/lumidex
Well Written Concise
andrea tasselli avatar
This sounds pretty much the feature I'm asking for, well mapping is, see: https://www.astrobin.com/forum/post/191869/
Tim Anderson avatar
Ummm . . . Wouldn't that tool be called Astrobin?

Tim
Salvatore Iovene avatar
Hi think that Joshua would like some features that are currently not available on AstroBin, from what I interpreted. The good news is that I'm just in the planning phase for a set of features that I believe will make Joshua and a lot of people here very happy smile I can't spill the beans with too many details, unfortunately, but I'm very excited, and AstroBin will become even more useful!
Dunk avatar
Willem Jan Drijfhout avatar
Astroplanner can do some of the things you mention. I use it all the time for planning and cataloging. It is designed with visual astronomy in mind, but almost everything can be adjusted and customized using user-defined fields. I've created a whole bunch of them dedicated to imaging, and find it quite easy to catalogue the status of my sessions. For example I use it to automatically populate the tables on my website for each target. For graphing/tabulating data, you would probably want to use an export to an external program. This can be as simple as Excel, or more advanced visualisation software. The built-in graphing options can give you some of the heat maps that you're looking for, see attached images.

Number of observations per constellation:


Objects photographed:
Well Written Helpful Engaging Supportive
Ferrante Enriques avatar
you can try the software I made for that purpose:
https://github.com/fenriques/AstroDom
Still in beta though.

The idea of an overlay of the sky map is a nice feature, I will add it to the to do list.
Ferrante
joshua deherrera avatar
Will check all out, thank you very much.  This isnt only for my personal imaging. which I could use an online catalog for.
I image for my work as well. My work imaging they require everything be on our internal systems, tightly locked down with zero internet access.
The overlay ask is so TPTB can see updates visually on coverage.
joshua deherrera avatar
My minmum coverage for a work shot is a 20 tile mosaic. Which means I have lot different captures in progress, depending on whats best that day.
Related discussions
DEC going nutts
Hello everyone! I'm at a point where I run out of ideas what to do and I hope someone can help me. My Gear: CEM 70, ZWO everything with AsiAir, EAF, 120mm mini, ES ED 127mm I have a journey of tracking problems behind me and it just won't sto...
Aug 11, 2023
Both posts describe astronomers seeking solutions to persistent technical challenges in their astrophotography workflows.
Slew rate does not make sense
Hi, I have a problem where NINA (or possibly SynScan Pro or the mount) is slewing way faster in the RA axis than it thinks it is. This leads to the mount overshooting substantially and I have no idea how to fix this. The following is what I can see:P...
Oct 13, 2025
Both posts describe practical challenges astronomers face with managing their equipment and observational data.