Hi,
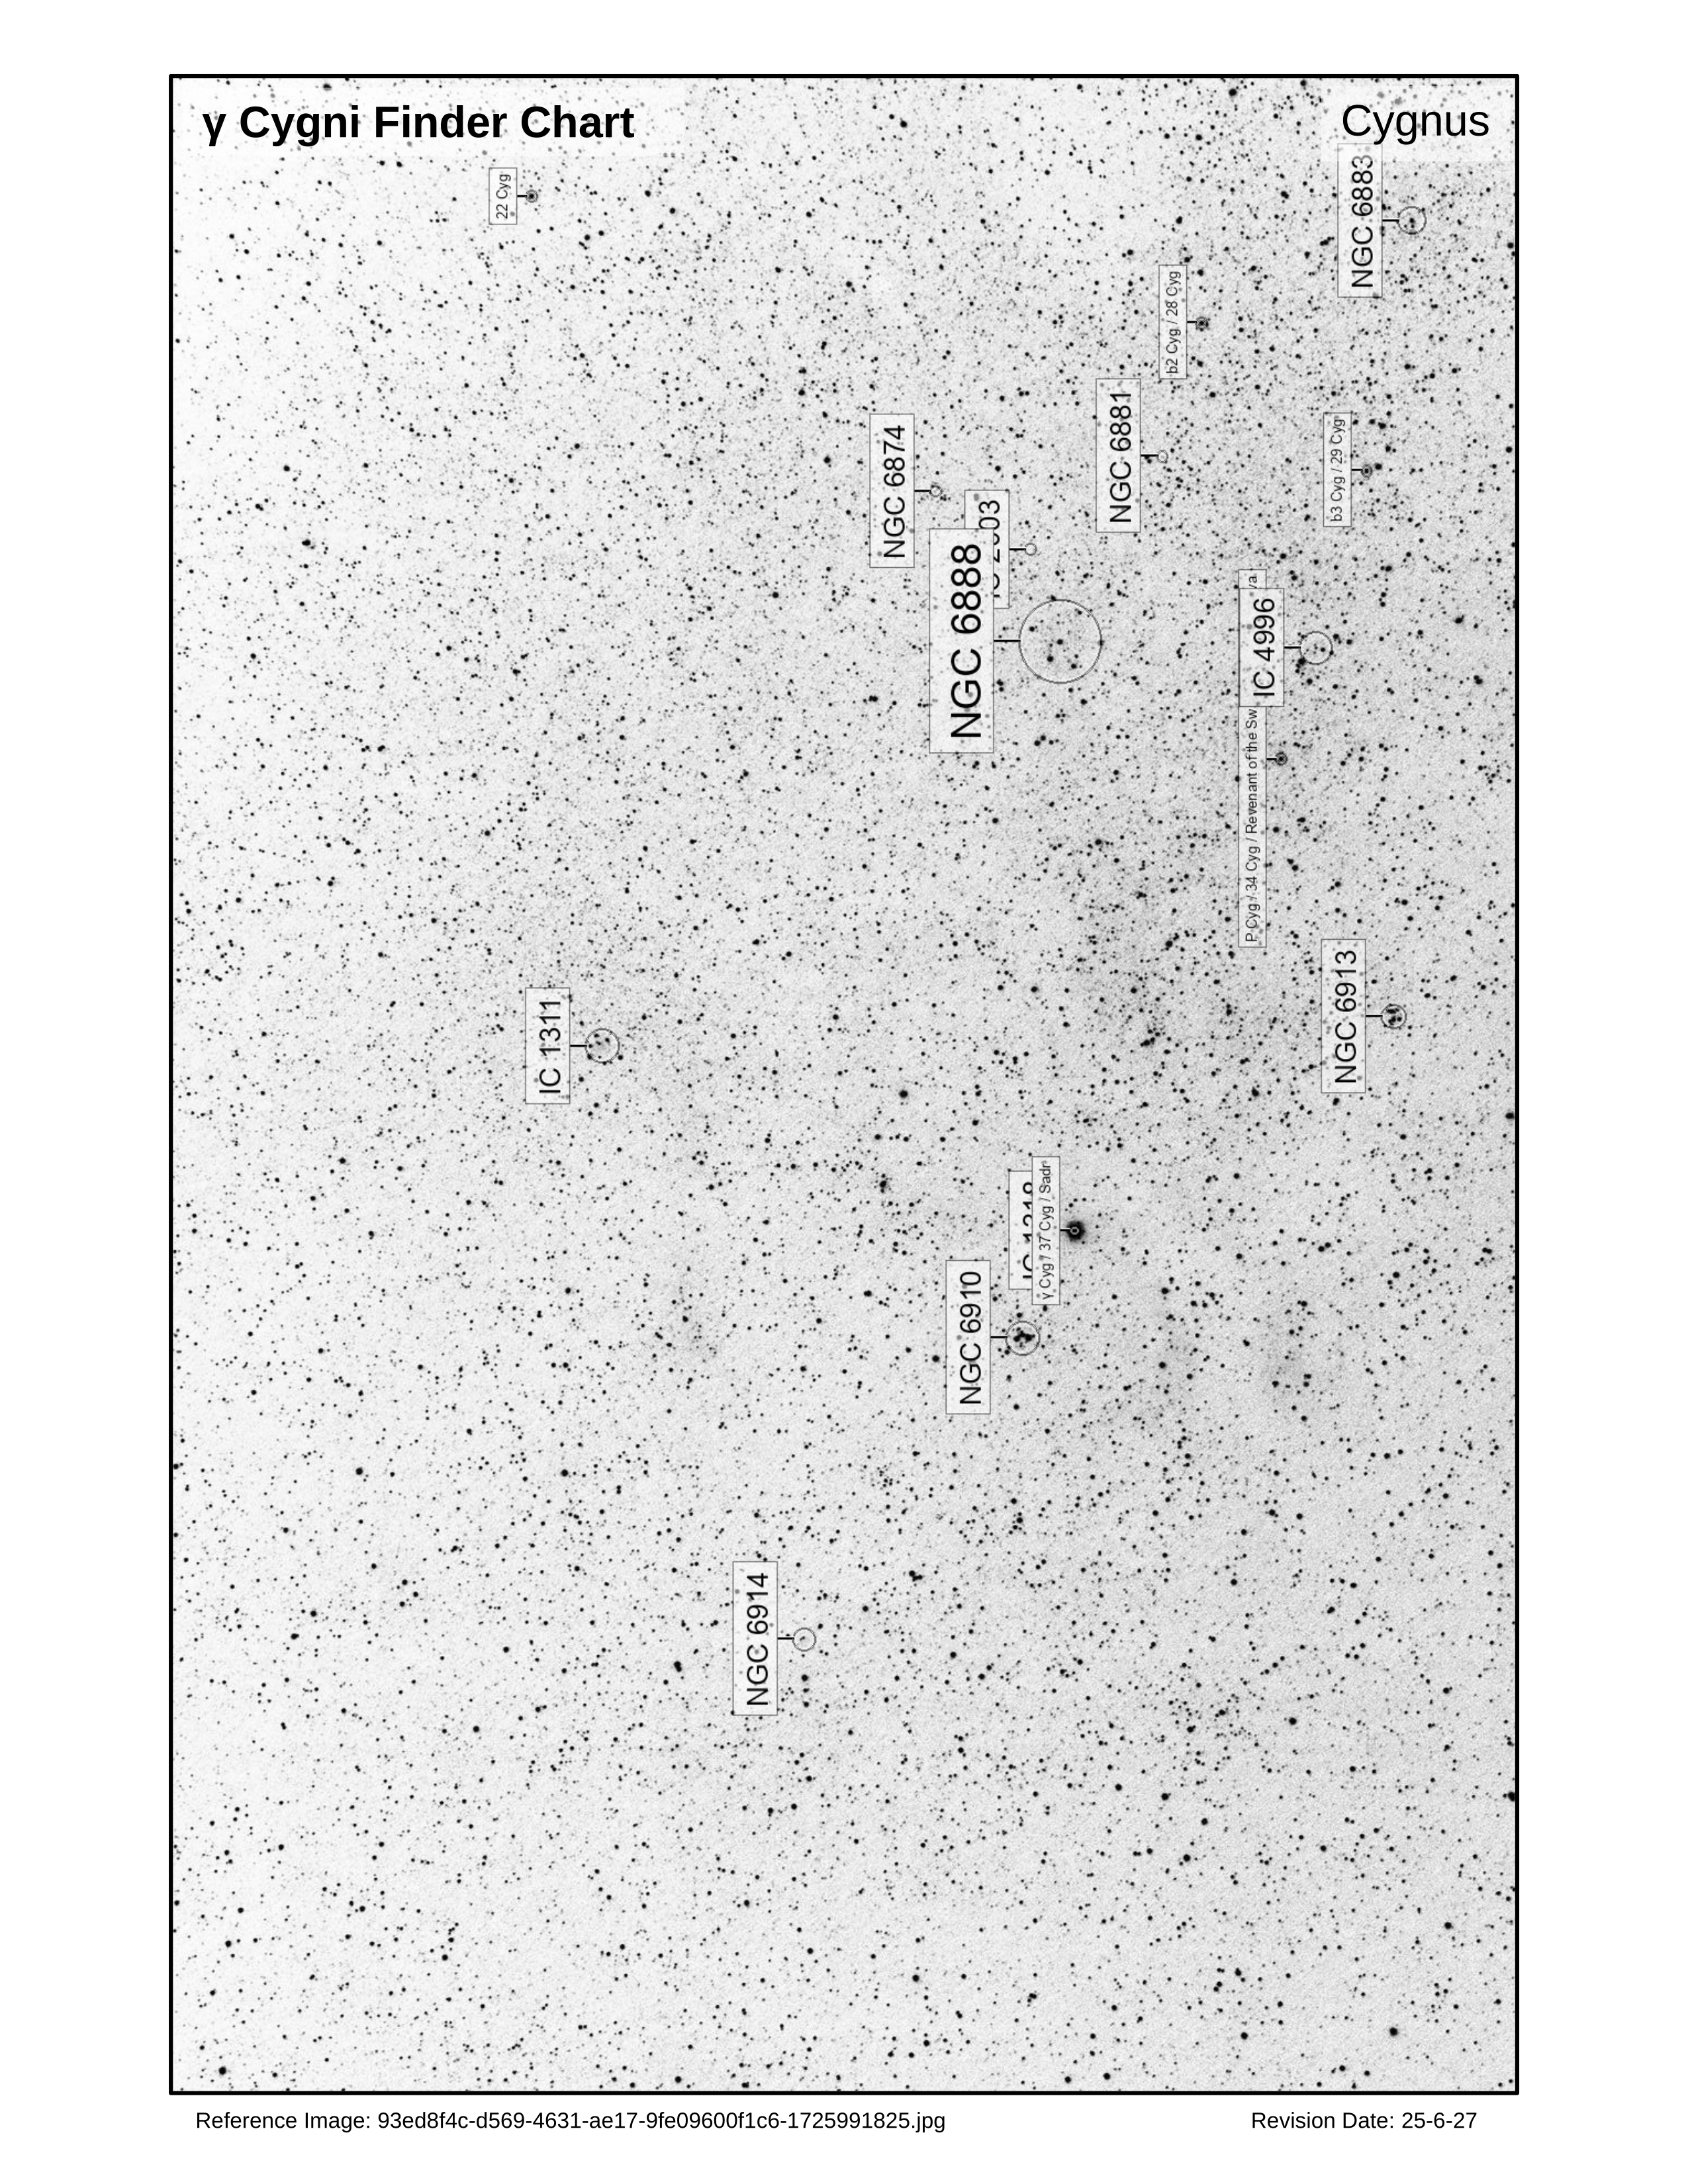
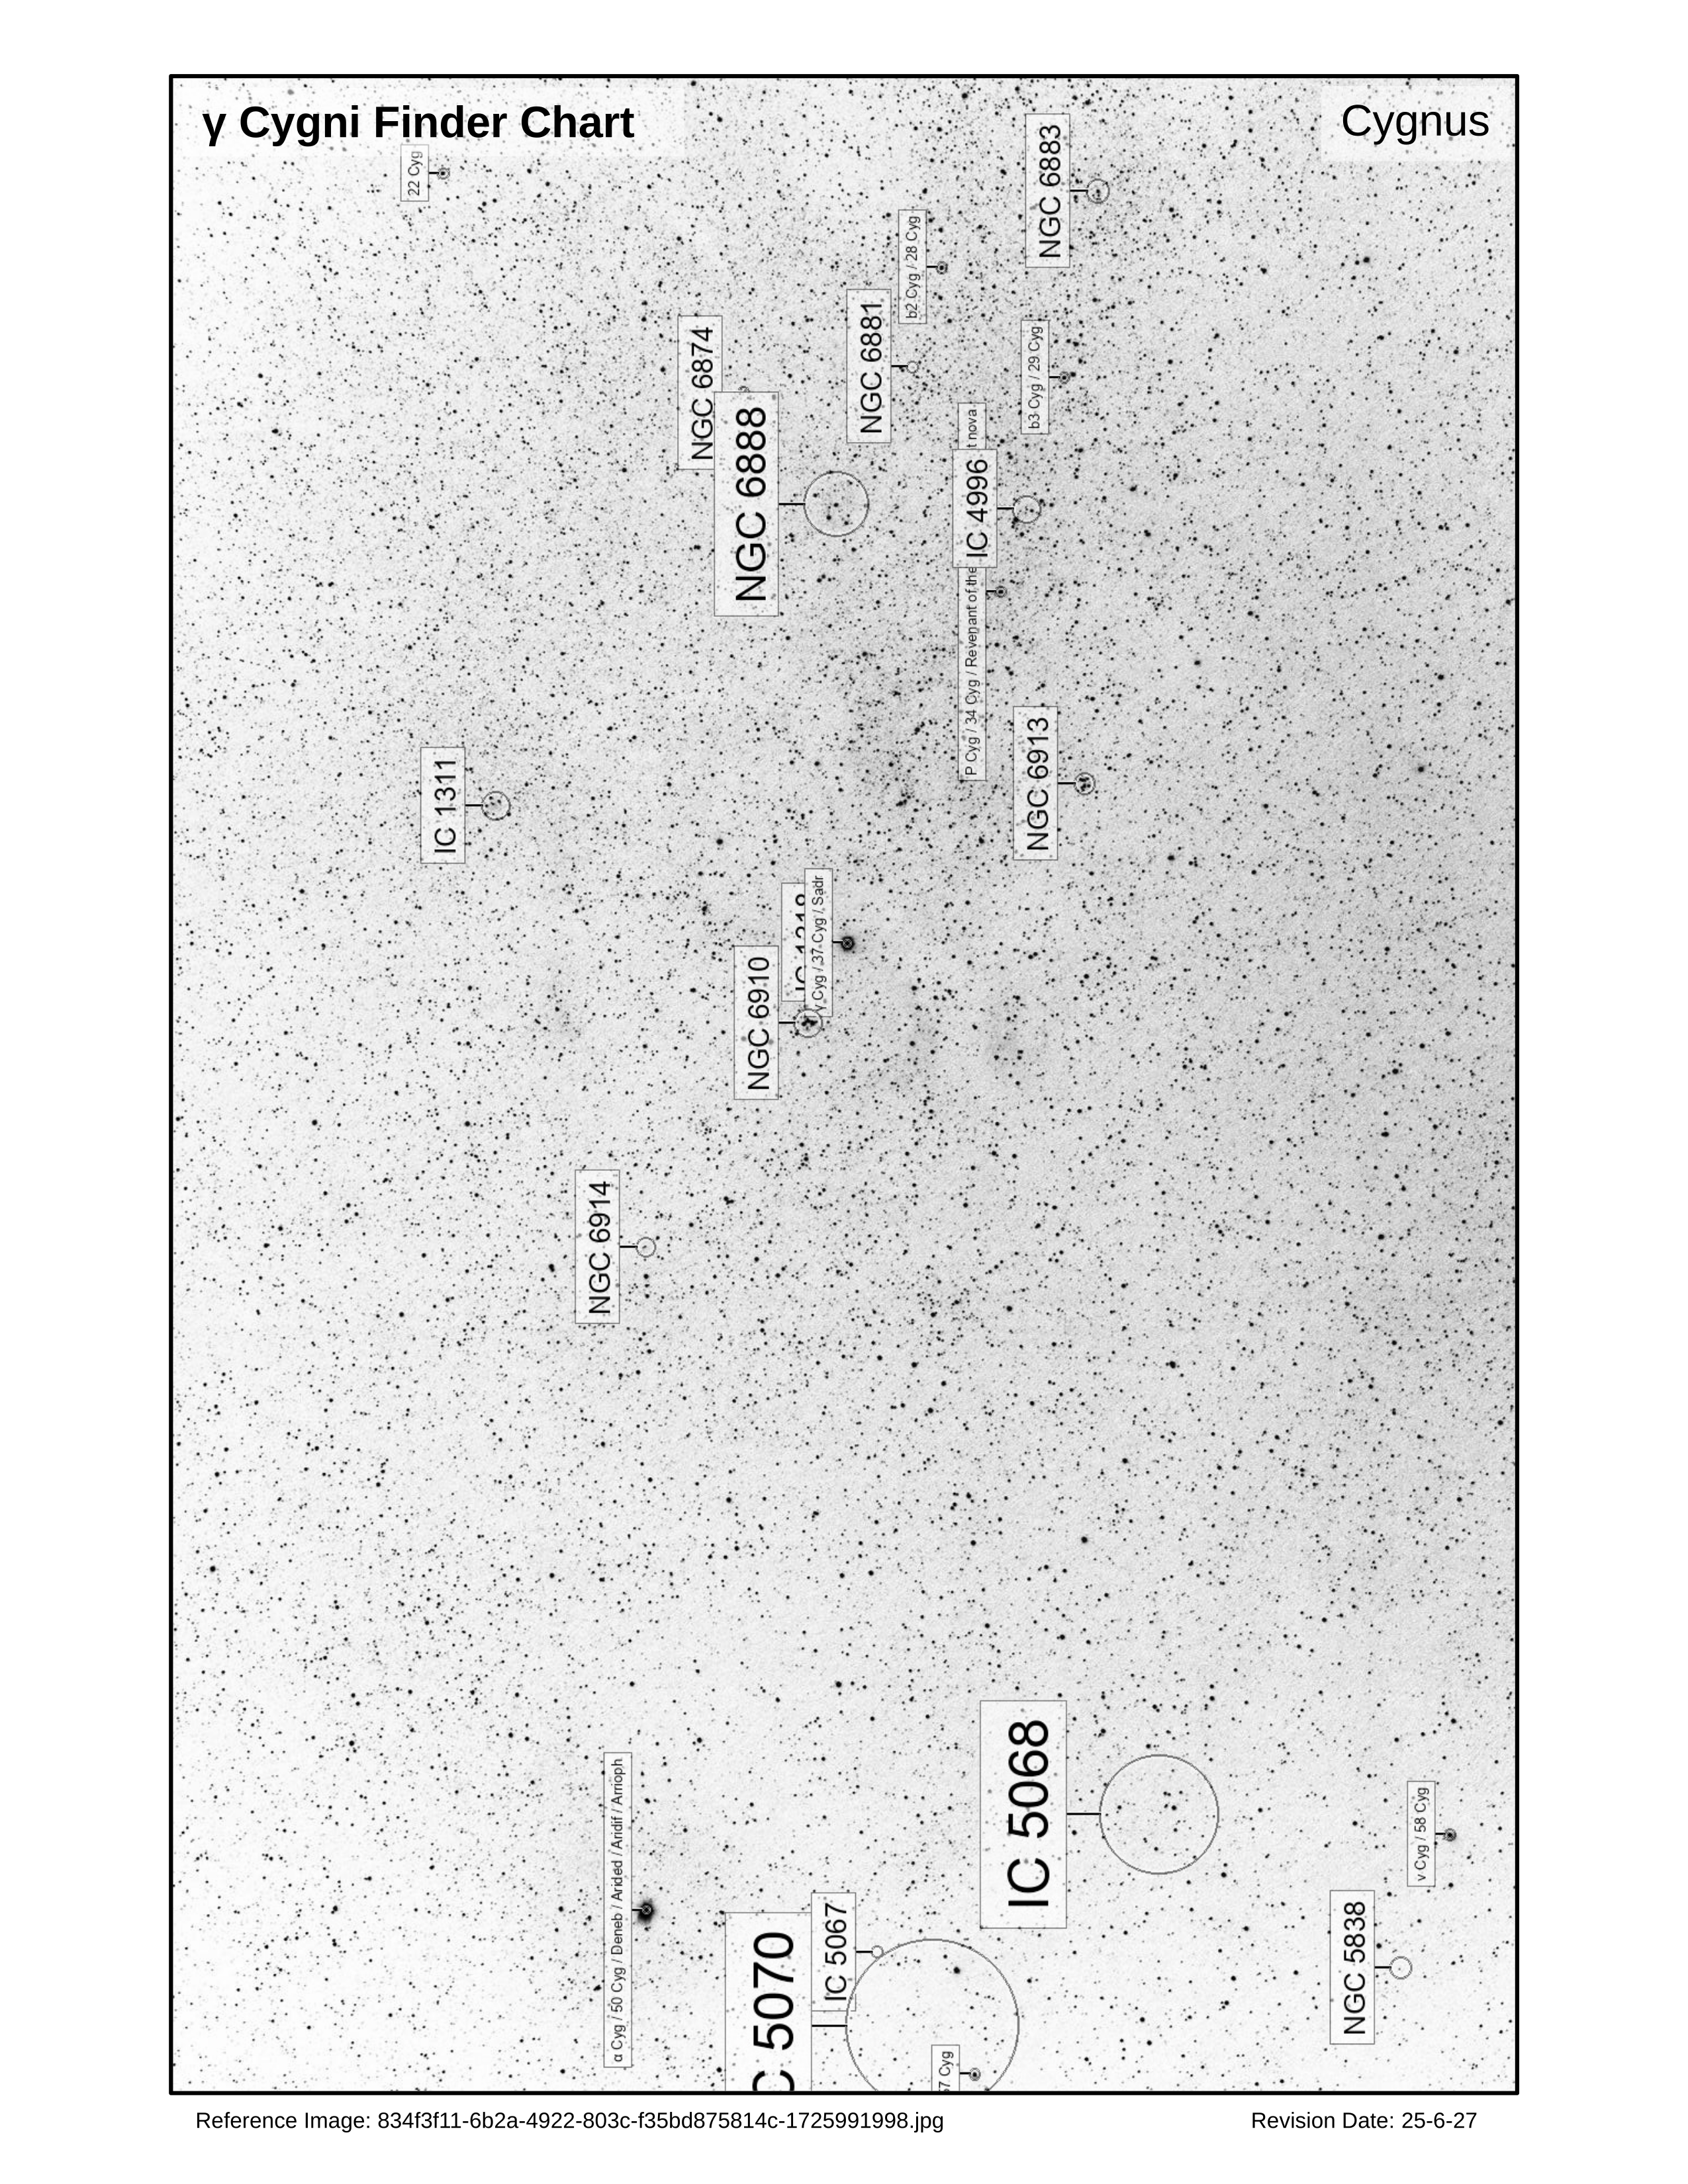
I just wanted to share an experimental personal project that I started. I like to use my photos to study star atlases and the idea dawned on me that I can use my own photos to generate my own custom star charts. Basically, I open the photo in GIMP and then create a second white chart layer. I set the opacity of the chart layer to 50% and then draw the principal stars in GIMP over the photographic stars in the photo layer, along with objects of interest. Afterwards, I adjust the opacity of the chart layer to 100% and export to PNG, TIF and JPG formats. Finally, I import the image in LibreOffice and do some basic labelling before exporting to PDF format. I'm posting my first try here. In further charts, I would like to add image scale, direction and star magnitudes. Sure, I could use a planetarium program to print charts, but this project has a certain do-it-yourself satisfaction level. I intend to use these charts for visual observing.
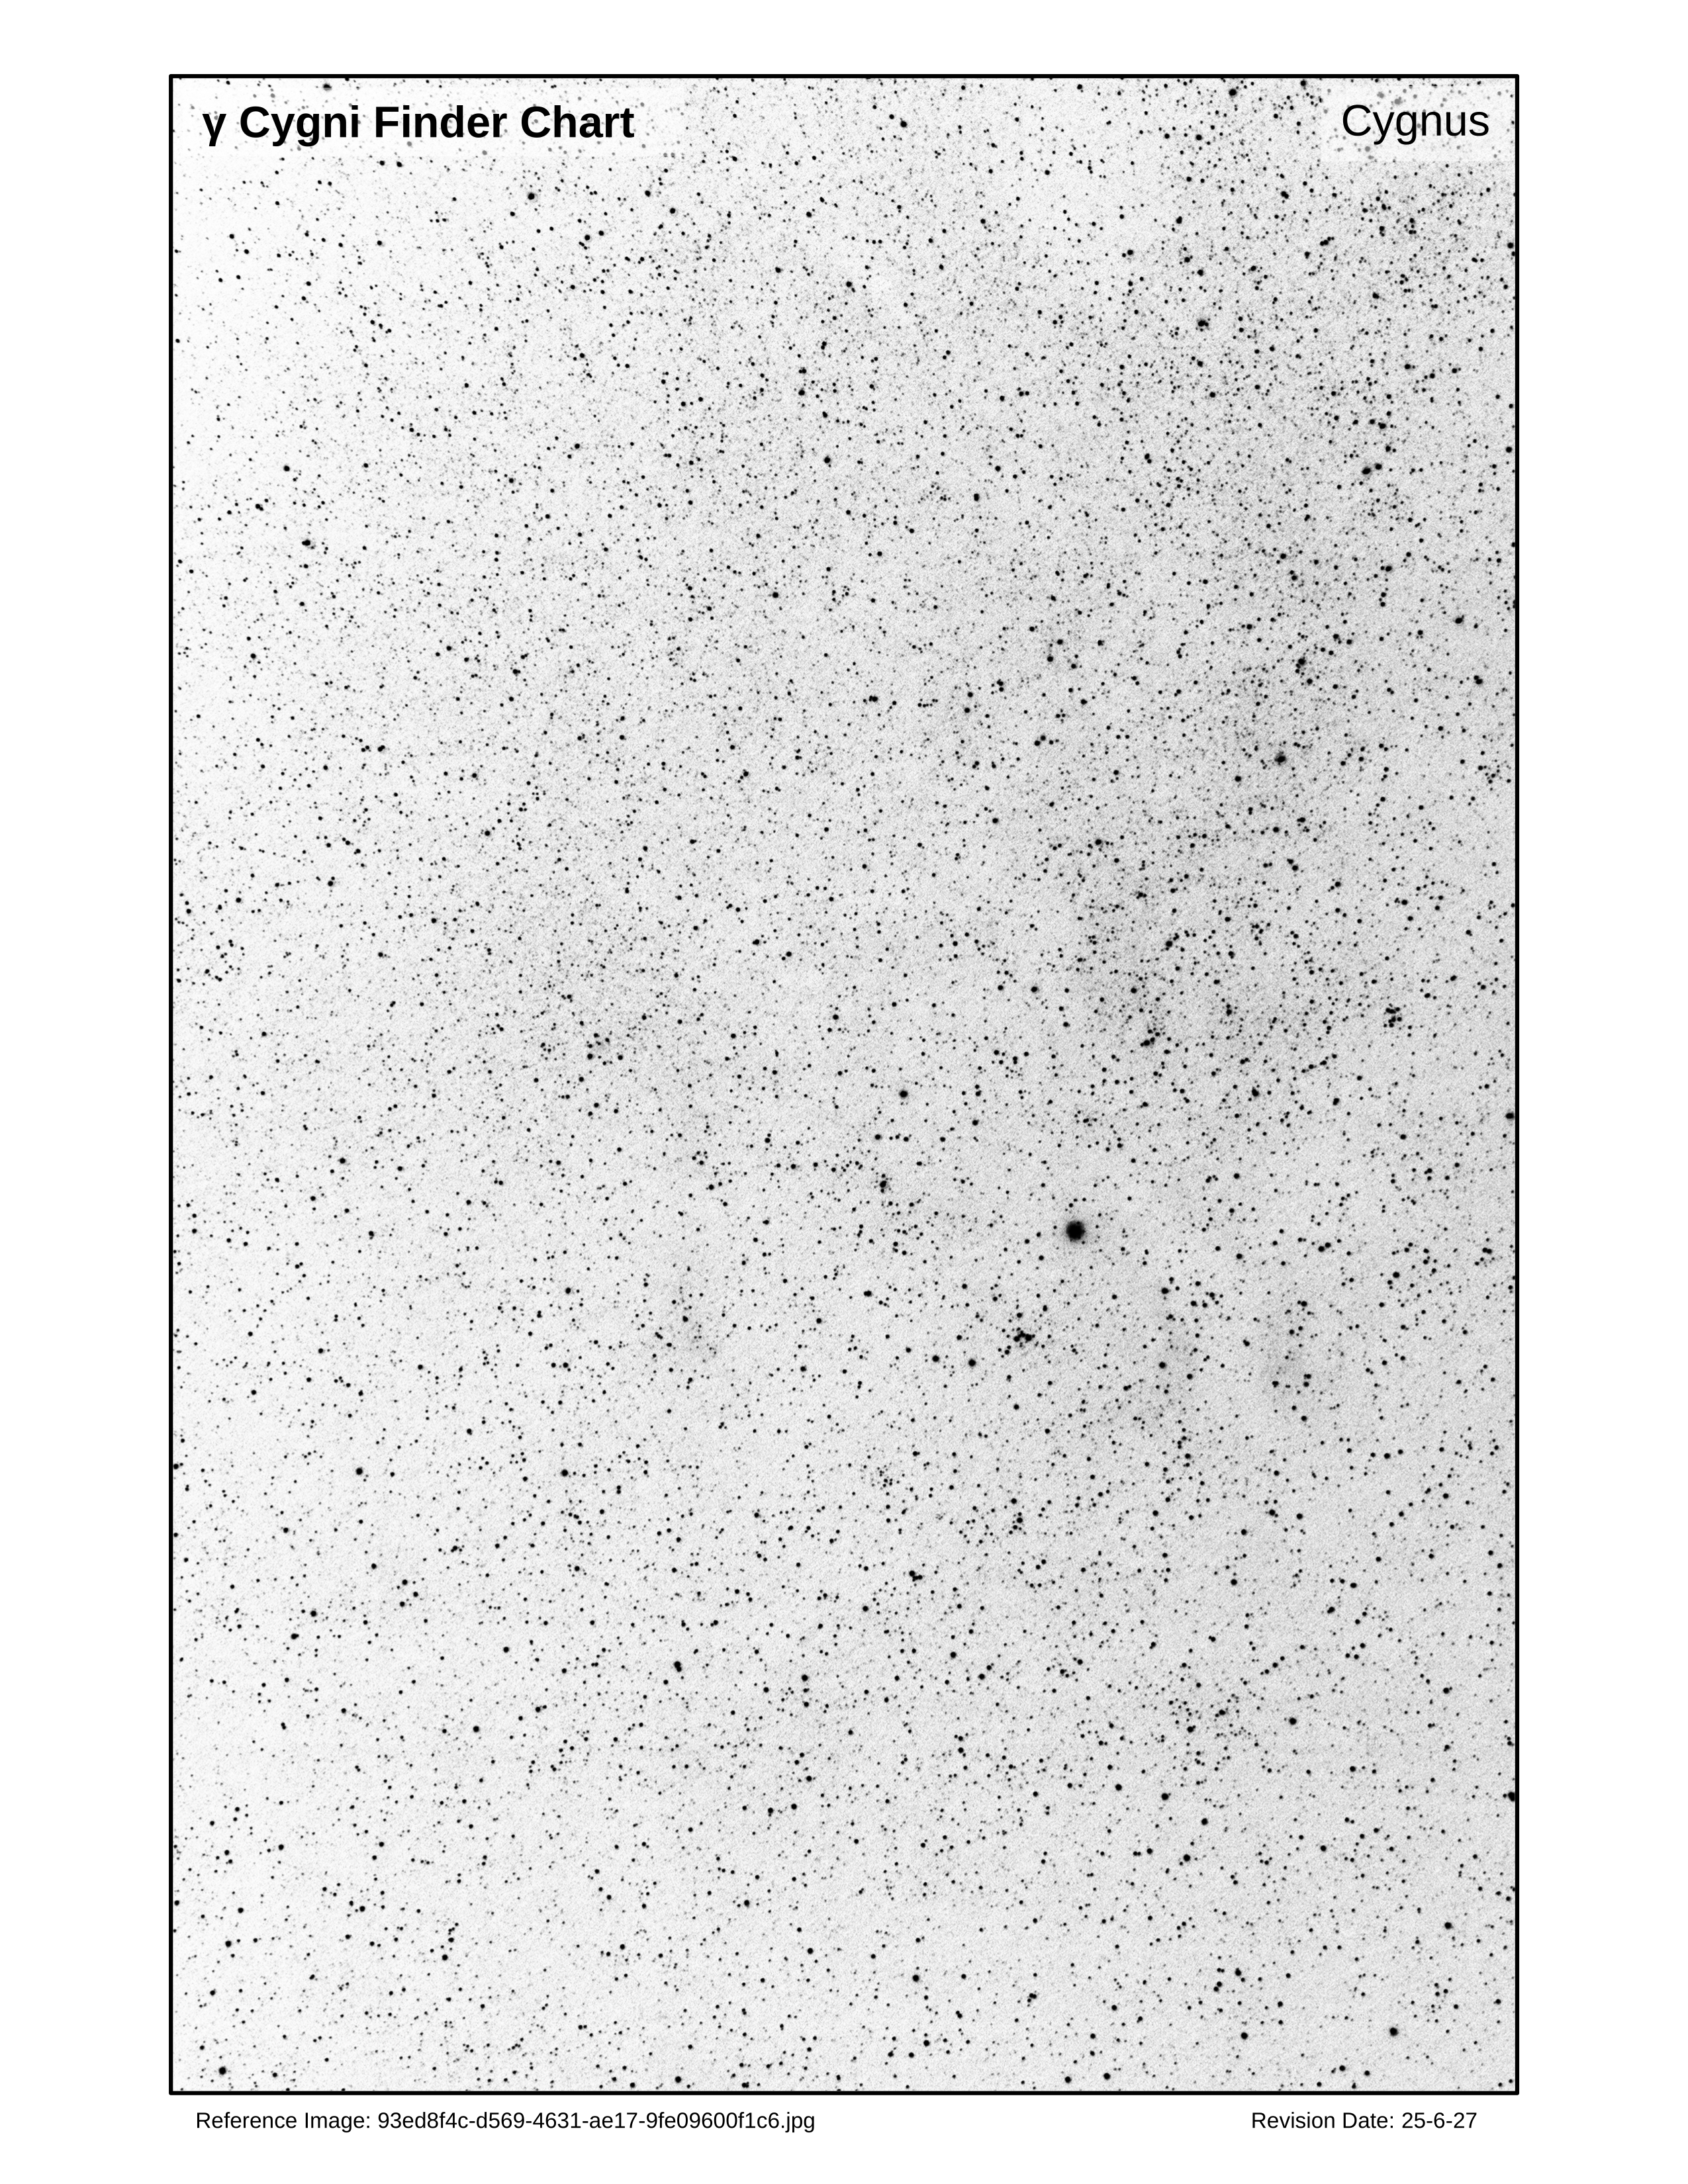
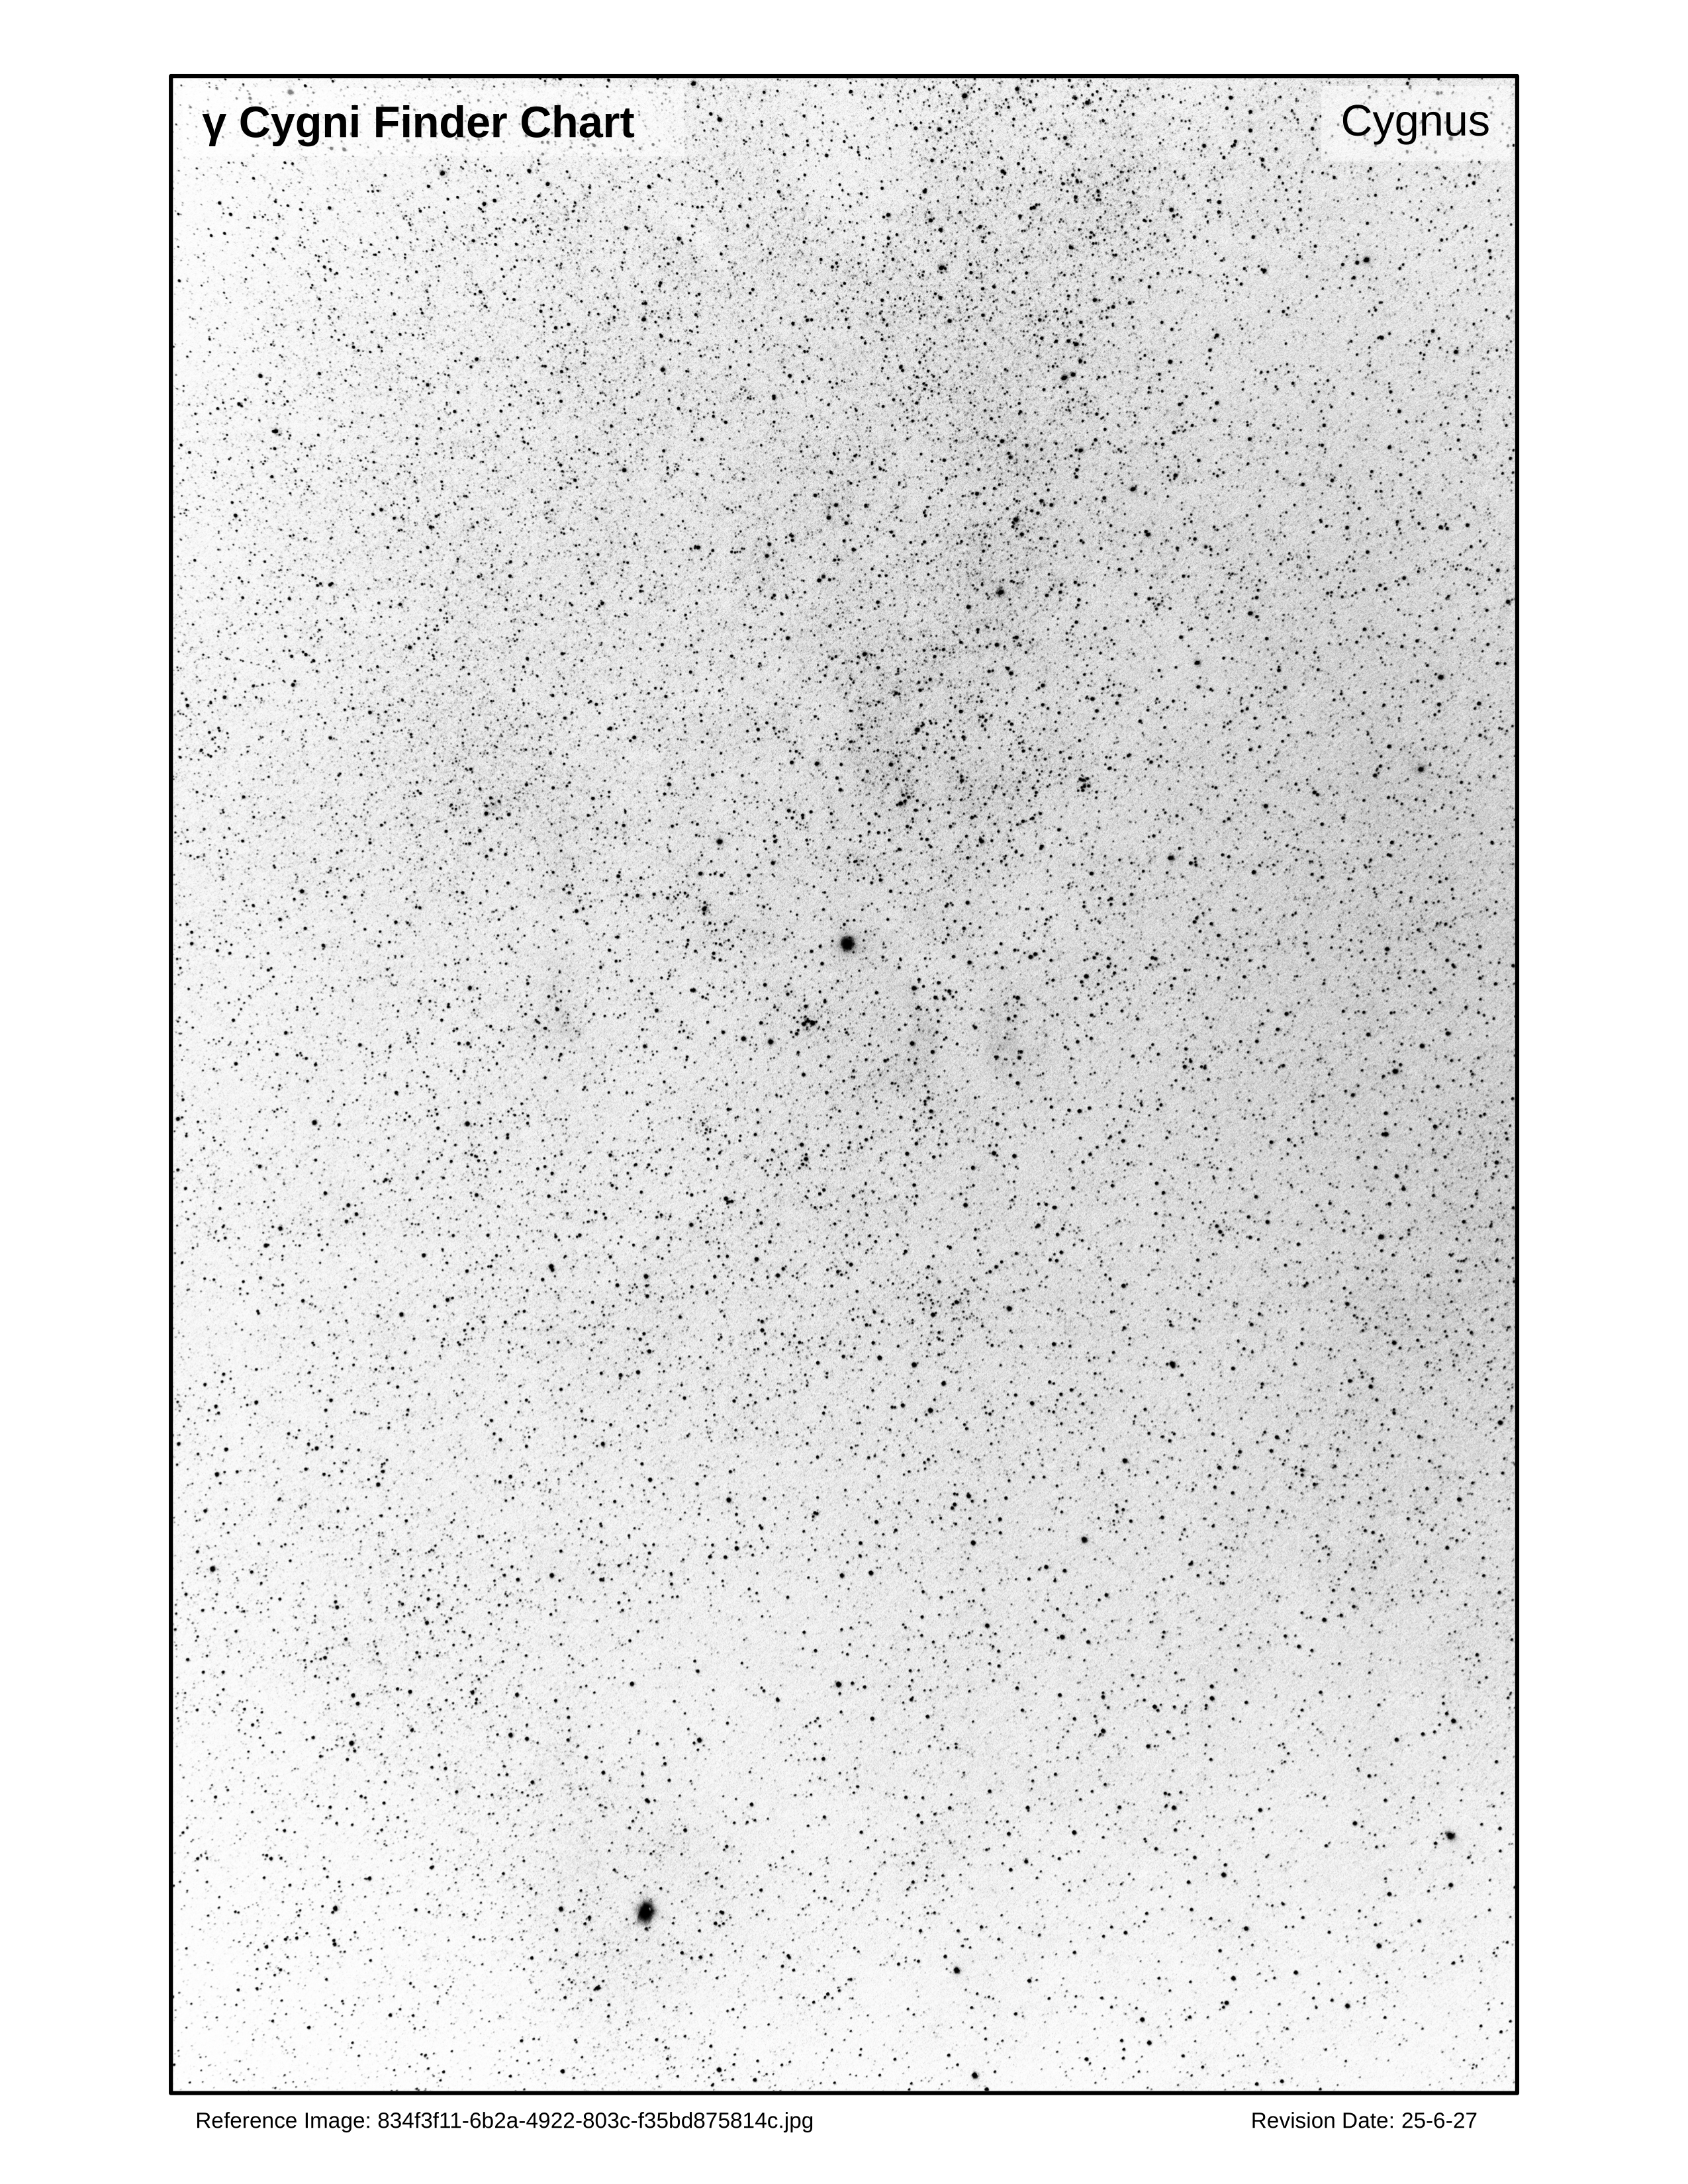
Here's the reference image that I used and the resulting charts from this process.
Steven

Leo


I just wanted to share an experimental personal project that I started. I like to use my photos to study star atlases and the idea dawned on me that I can use my own photos to generate my own custom star charts. Basically, I open the photo in GIMP and then create a second white chart layer. I set the opacity of the chart layer to 50% and then draw the principal stars in GIMP over the photographic stars in the photo layer, along with objects of interest. Afterwards, I adjust the opacity of the chart layer to 100% and export to PNG, TIF and JPG formats. Finally, I import the image in LibreOffice and do some basic labelling before exporting to PDF format. I'm posting my first try here. In further charts, I would like to add image scale, direction and star magnitudes. Sure, I could use a planetarium program to print charts, but this project has a certain do-it-yourself satisfaction level. I intend to use these charts for visual observing.
Here's the reference image that I used and the resulting charts from this process.
Steven
Leo


