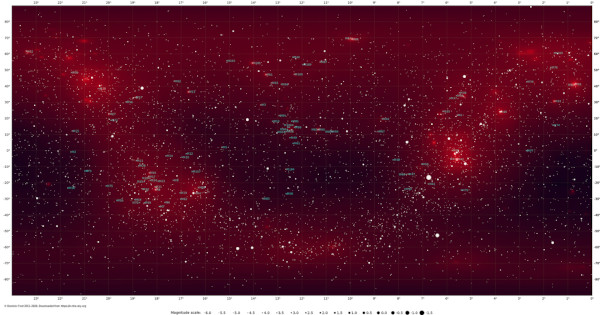
Thanks Jérémie, this is very interesting. Is there a plan to keep an update of this as part of Astrobin. I think there is utility in this, might be interesting to have tabular data available as well...
Dave
Hi Dave,
Thanks for your feedback and interest.
About the frequency of update, I guess it will depend from Salavatore and probably from the interests from the community with this « data representation ». The code is published on Github, so anyone with the data - and time to setup OpenCV on Python with all the versionning issues :-) - can play with that.
I am of course ready to run the code again, maybe once a month (this high resolution map took 12hours of calculation - poor coding probably - but the runtime is % to the image area, so half the size is manageable on my side more often). But given the high number of pictures, I am not sure you will notice much difference in the map between 2 consecutive months. Except if people drastically change their behaviors using the map (?).
Anyway, I think fun things could be done with these data or with extended data :
- a map of the average number of likes per « pixel of sky » (to be independent of the number of pictures taken of a given area of the sky)
- an index of each astrophotographer based on : the % of the sky its pictures cover altogether, each pixel weighted by (i) its « marginal contribution » to the imaging of this area (so for each pixel of sky he photographed, we can check how much it contributes to the knowledge of this area : 1 new picture of a pixel of sky already taken 10 times will weight more than 1 picture of Orion taken 10000 times); and (ii) the resolution of its picture (a large mosaic requires much more work than the same area taken one shot with a smaller focal length)
I think we can have endless ideas, but I stop there because the forum talking about Astrobin is now closed :o) All apologies Salvatore !
Jeremie